On this page
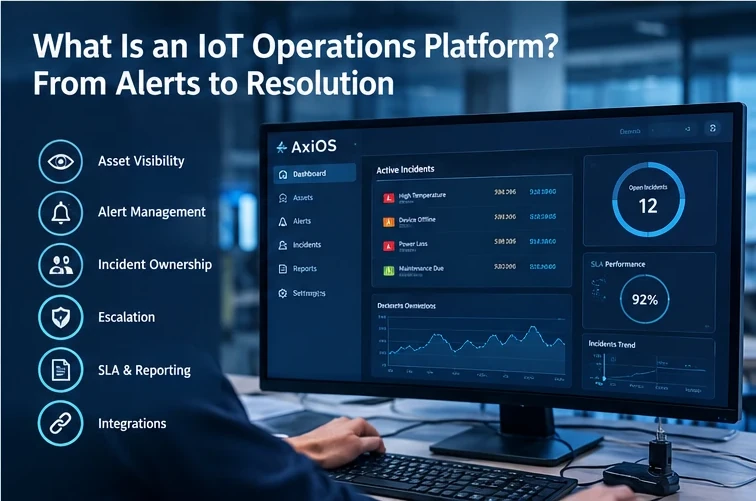
An IoT operations platform helps organisations monitor and manage connected assets, sites and operational events through a centralised system.
A basic IoT deployment may collect sensor readings and display them on dashboards. An operations platform goes further: it helps teams interpret exceptions, assign responsibility, coordinate responses, track incidents and review performance.
This matters when an organisation manages equipment across many locations. A growing stream of telemetry creates limited value if teams cannot tell which events matter, who should respond or whether the issue has been resolved.
01What is an IoT operations platform?
An IoT operations platform aims to connect technical visibility with operational execution.
02Telemetry collection is only the beginning
Telemetry is data generated by connected equipment, such as temperature, pressure, energy consumption, device status or equipment alarms.
What telemetry answers
What did a sensor report? When did a device last communicate? Is a value above or below a threshold? What changed over time?
What operations teams also need
Does this need action? Which site and asset? Who owns it? Acknowledged? Escalate? What was done? Resolved? How is performance reported?
An operations platform should help answer these questions through a consistent workflow.
03The core components of an IoT operations platform
1. Asset and site hierarchy
Organisations, locations, sites, assets, devices and sensors, with consistent naming so events reach the right team.
2. Device and data visibility
Current readings, recent history and connectivity status. A last-known reading must not look current when a device has stopped reporting.
3. Rules and alert management
Thresholds, operating states and missing-data rules, with severity, clear details, deduplication and controls for low-value notifications.
4. Incident management
An alert signals a condition; an incident needs investigation or coordinated action: acknowledgement, assignment, status, notes, escalation and closure.
5. Escalation and ownership
What happens when an event is not acknowledged or resolved in time, by severity, site, asset type, time of day or team, tested for critical events.
6. SLA visibility
Whether response or resolution commitments are met. Acknowledgement time and resolution time are different metrics.
7. Reporting and operational review
Event volumes, open incidents, repeated faults, response times and site comparisons that support decisions.
8. Integration and security
Ticketing, maintenance and enterprise systems, with clear data ownership, plus permissions, device identity, secure communication and audit records.
Define SLA measurements precisely before reporting them: calculations may depend on business hours, pauses, severity levels and contractual exclusions. A dashboard is only as reliable as the rules and data behind it.
04The IoT operations lifecycle: from reading to resolution
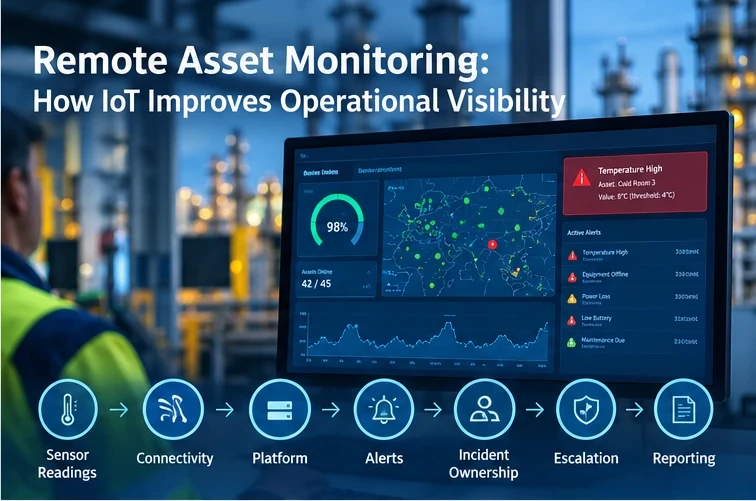
A practical operations workflow can be described in eight stages.
Observe
A connected device reports a measurement or operating state.
Validate
The system checks the reading, its timestamp and data quality.
Detect
A configured rule identifies an exception.
Notify
The appropriate user or system receives an alert.
Assign
A responsible person or team takes ownership.
Escalate
The workflow routes the event onward when defined conditions are met.
Resolve
The team investigates, acts and records the outcome.
Review
History and incident records support reporting and improvement.
Not every alert needs to become an incident. Some events are informational, others need immediate action; the workflow should reflect the operational risk and response requirements.
05Illustrative example: a remote equipment alarm
This is an illustrative workflow, not a reported AXITEQ customer result. A company operates equipment at several remote sites. A device reports a condition outside its configured range; the platform evaluates the rule and generates an alert with the site, asset, timestamp and value. The designated team acknowledges it and decides an on-site inspection is needed. If the issue had stayed unacknowledged beyond the configured interval, the platform would have escalated it. After the inspection, the findings are recorded and the incident status updated, and the history remains available for reporting.
The operational benefit is not simply that an alarm appeared on a screen. It is that the organisation can follow the event from detection through ownership and resolution.
06IoT operations platform vs. basic monitoring dashboard
A dashboard can be an important part of an operations platform, but the two are not necessarily equivalent.
Swipe to compare
| Capability | Basic monitoring dashboard | IoT operations platform |
|---|---|---|
| Display sensor readings | Common | Common |
| Show device and asset status | May be available | Expected where required |
| Generate rule-based alerts | May be available | Common |
| Assign incident ownership | May be limited | Important operational capability |
| Escalate unacknowledged events | Not always included | Useful where workflows require it |
| Track incident lifecycle | May require another system | Often a core workflow |
| Monitor SLA measures | May require custom work | Useful for managed operations |
| Provide operational reporting | Depends on the tool | Should support defined metrics |
| Integrate with enterprise systems | Varies | Important for broader workflows |
These are general distinctions, not guarantees about every product. Some dashboards offer advanced workflows, and some platforms need integrations for particular functions. Evaluate actual capabilities against your requirements.
07How to evaluate an IoT operations platform
- Start with operational workflows.
Describe how an event moves through your organisation: who receives it, who owns it, when it escalates and what evidence closes it.
- Check the full asset lifecycle.
How sites, assets, devices and sensors are represented, and how changes are managed as equipment is installed, moved, replaced or retired.
- Test alert quality.
Use realistic scenarios for thresholds, missing data, repeated events, notification delivery and escalation.
- Verify reporting definitions.
Agree what acknowledgement time, resolution time, incident count and SLA compliance mean, and confirm consistent reporting.
- Review integration and security.
API availability, supported integrations, access controls, audit records, data handling and remote-access design.
- Test usability at operational scale.
Ask real users to find an affected asset, investigate an event, assign an incident and review its history.
08Where AxiOS fits
AXITEQ’s AxiOS platform is positioned around connected-asset visibility and IoT operational monitoring. When evaluating AxiOS or any other platform, map the required workflows to the capabilities actually available for your deployment.
Learn more about AxiOS and review AXITEQ’s Security page for relevant platform security information.
From connected devices to managed operations.
An IoT operations platform bridges connected equipment and the people responsible for running it. By linking telemetry with alerting, ownership, escalation and reporting, organisations get a more consistent way to manage distributed assets. Explore AXITEQ’s services or request a demo.
 Denver (USA)
 Riyadh (KSA)
 Islamabad (PK)
- Choose one recurring operational event
- Map its journey from detection to resolution
- List the capabilities that journey actually needs
10Frequently asked questions
What is an IoT operations platform?
A centralised system that helps organisations monitor and manage connected assets, sites and operational events, linking telemetry with alerts, ownership, escalation, incidents and reporting.
How is it different from a monitoring dashboard?
A dashboard mainly displays readings and status. An operations platform adds workflows such as incident ownership, escalation, lifecycle tracking and SLA reporting, though capabilities vary by product.
What is the difference between an alert and an incident?
An alert signals a condition. An incident represents an issue that requires investigation or coordinated action, with acknowledgement, assignment, status and closure.
How should SLA performance be measured?
Define each metric precisely first. Acknowledgement and resolution time differ, and calculations may depend on business hours, pauses, severity and contractual exclusions.
How do we choose the right platform?
Start from your operational workflows, test alert quality and reporting definitions with realistic scenarios, review integration and security, and test usability with real users.
11Final thoughts
The right IoT operations platform depends on your equipment, workflows, security requirements and the operational measures that matter to your business.
Before comparing platforms, ask three questions- Which recurring event matters most to your operation?
- Who owns it from detection to resolution?
- Which capabilities are essential, and which are just nice to have?